0%

一个阶段性的总结

HI Neway。hou nai mo giai!现在是加州的晚上11点,不像香港的湿热、湖南的变幻、匹兹堡的阴沉,加州的太阳特别好,每次骑单车出门时都会被那恰到好处的阳光惊艳到,然后有种想立刻出去hiking的冲动。我也算理解为什么那么多人都说加州比匹兹堡好多了。

我想我需要回顾下过去半年、或者来CMU的一年发生了什么。之前说要投两篇paper:最终还是做到了——虽然又做了一次deadline fighter,写作质量什么的也无法顾及。

能力 想做的

其实我对自己的状态是挺不满意的。

大概来说,感觉自己是个“心比天高”却又“力比纸薄”的人物。我有好多想做的,但是自己的能力却又跟不上这些志向。

要学的 想学的 眉毛紧锁 焦虑

人生海海

至少快乐伤心是我自己决定

This is a reading notes for recipe generation papers, whcih is for my 10701 projects.

Generating Personalized Recipes from Historical User Preferences

Input:

  • the tokenized name of a specific dish, (vocabulary embedding)
  • a few (partial) key ingredients (ingredient embedding )
  • calorie level. (caloric-level embedding)

tokenization method: Byte-Pair Encoding (BPE) tokenization

Output

tokenized recipe sequence

Approach

Input -> encoder-decoder -> attend with hiden user features (come from previous recipe ranking of this particular user) -> combine them with a attention fusion layer to jointly determine text generation

Encoder

BiGRU for dish name and ingredients

Projection for calorie level

Decoder ((output: recipe embeeding ($h_t$)))

two-layer GRU, where first layer input $h_0$ is the concatenation of the output from the encoder, for each layer, there is an attention term that calculates an weighted sum of the encoded ingredient feature

Combine with user hitorical review data

Each prior reviewed recipe has a recipe embedding, and is used to calculate the recipe attention

Each recipe has multiple used techniques and we use them to calculate the recipe

Attention Fusion Layer

fuse all contexts calculated at time t, concatenating them with decoder GRU output and previous token embedding:

image-20220417165336643

$o_t$ is the output of decoder, $a_t^i$ is the ingredion features (calculated based on weighted sum of ingredient sum), $a_t^{r_u}$ is the user recipe feature (calculated based on weighted sum of user previous ranked recipe representation)

Final output

Top k sampling means sorting by probability and zero-ing out the probabilities for anything below the k’th token. It appears to improve quality by removing the tail and making it less likely to go off topic

Experiments

Dataset

Here, we restrict to recipes with at least 3 steps, and at least 4 and no more than 20 ingredients.

We discard users with fewer than 4 reviews, giving 180K+ recipes and 700K+ reviews

in our training data, the average recipe length is 117 tokens with a maximum of 256.

Train/Test/Validation

We order reviews by timestamp, keeping the most recent review for each user as the test set, the second most recent for validation, and the remainder for training

Cooking techniques

We manually construct a list of 58 cooking techniques from 384 cooking actions collected by Bosselut et al. (2018b);

Evaluation metric

BLEU (bilingual evaluation understudy) is an algorithm for evaluating the quality of text which has been machine-translated from one natural language to another. each word in the output has a maxinum clip value, which is the count in the true labels.

ROUGE-L: Longest Common Subsequence (LCS)[3] based statistics

Personalization (randomly 9 user input + 1 golden user input -> output probability of word (prob of sensente ))

(UMA)—the proportion where the gold user is ranked highest—

Mean Reciprocal Rank (MRR) (Radev et al., 2002) of the gold user

Recipe Level Coherence:

Ranking

input : recipe, user

Output: score (recommendation value) (classification -> soft label [0.2,0.1,0.4,0.1,0.1]) (regression)

Generator

Input: user

Output: recipe for this user

PAC learning try to study the generalization ability for a learning model (given a set of training data, its ability to carry over to new test data)

I recommend for reading this blog post (by the original author)

https://jeremykun.com/2014/01/02/probably-approximately-correct-a-formal-theory-of-learning/

Approximately correct means the error will be small on new samples,

Probably means that if we play the game over and over we’ll usually be able to get a good approximation.

Some Definitions (informal, just for easier understanding)

  • Error of hypothesis $h$ (with respect to the concept (our target, the “golden” solution) $c$ and the distribution $D$ ) is the probability over $X$ drawn via $D$ that $h(X)$ and $c(X)$ differs.

  • concept class: a collection of concepts (functions) over $X$

  • PAC Learnable: A problem is PAC-learnable if there is an algorithm $A$ which will likely generate a hypothesis whose error is small for all distributions $D$ over $X$.

    • More formal one: small error -> error probablity = $\epsilon \in [0,0.5]$; high probability -> $1 - \delta$ : $\delta \in [0,0.5]$. Then, we limit the algorithm to run in time and space polynomial in $1/\epsilon $ and $1/\delta$

      Let X be a set, and \mathsf{C} be a concept class over X. We say that \mathsf{C} is PAC-learnable if there is an algorithm $A(\varepsilon, \delta)$ with access to a query function for \mathsf{C} and runtime $O(\textup{poly}(\frac{1}{\varepsilon}, \frac{1}{\delta}))$, such that for all c \in \mathsf{C}, all distributions D over X, and all inputs $\varepsilon, \delta$ between 0 and 1/2, the probability that A produces a hypothesis h with error at most \varepsilon is at least 1- \delta. In symbols:

      $\displaystyle \textup{P}{D}(\textup{P}{x \sim D}(h(x) \neq c(x)) \leq \varepsilon) \geq 1-\delta$

How to prove a problem/ a concept class is PAC learnable?

big idea:

  1. Propose $A$ with time complexity $O(m)$
  2. Show that $A \propto 1/\epsilon, 1/\delta$ , easy right? :)

Example 1 Interval Problem

The target is an interval $[a_0,b_0]$, each query (unit time cost) will randomly pick up a value $x \in [a_0,b_0]$.

We propose A: pick up $m$ samples, (therefore $O(m)$ time), and pick up the smallest one $a_1$ and the largest one $b_1$ as the predicted interval (hypothesis) $[a_1,b_1]$

We should consider $P(h(x)\neq c(x))$ (this one must be a formulation related with $m$, say $g(m)$), that is, show that if $P_D(g(m) \leq \epsilon) \geq 1- \delta$ , then $m \propto 1/\epsilon, 1/\delta$

$P(h(x)\neq c(x)) = g(m) = \textup{P}{x \sim D}(x \in A) + \textup{P}{x \sim D}(x \in B)$, where $A = [a_0,a_1], B = [b_1,b_0]$

then, by symmetry, if we can prove that $\textup{P}_{x \sim D}(x \in A) \leq 2/\epsilon$ is very probabilitic ($\geq 1-\delta$), then, we are done.

but, how to find the correlation between $\epsilon$ and $m$? The solution here is to define a interval $A’$, where $A’ = [a_0,a’]$ and $P(x\in A’) = 2/\epsilon$.

if $a’ \geq a_1$, we already finish the proof.

Othersiwe, the probability that the sample does not belong to $A$ (remeber that we are considering $\textup{P}{x \sim D}(x \in A) \leq 2/\epsilon$) is smaller than $1- 2/\epsilon$, i.e., $\textup{P}{x \sim D}(x \ not \in A) \leq 1 - 2/\epsilon$

then the probability that all $m$ samples does not locate in $A$ Is: $\leq (1 - 2/\epsilon)^m$

Note that this probability equals to the probability that the error ($h(x) \neq c(x)$) due to the $A$ region is larger than $2/\epsilon$ (the probability that our chosen A contributes error greater than \varepsilon / 2)

Such a proof holds for B region. Since A and B are not intersected, we can conclude that

The probabity that the error is larger than $\epsilon$ is less than $2((1 - 2/\epsilon)^m)$

it means, The probabity that the error is less or equal than $\epsilon$ is larger than $1 - 2((1 - 2/\epsilon)^m)$

We want the probability of a small error is larger than $1-\delta$, that is:

$\displaystyle 2(1 - \varepsilon / 2)^m \leq \delta$

therefore, $m \geq (2 / \varepsilon \log (2 / \delta))$

(which is polynomial in $1/\epsilon, 1/\delta$)Therefore, we finish the proof

Example 2 hypotheses/concepts in a finite hypothesis space

The theorem is:

Let H be a finite hypothesis space. Let D be an arbitrary, fixed unknown probability distribution over X and let c ∗ be an arbitrary unknown target function. For any , δ > 0, if we draw a sample from D of size ![Screen Shot 2022-04-01 at 10.36.58 PM](/figures/Screen Shot 2022-04-01 at 10.36.58 PM.png)

then with probability at least 1 − δ, all hypotheses/concepts in H with error ≥ $\epsilon$ are inconsistent with the sampled data

(with probability at least 1−δ any hypothesis consistent with the sampled data will have error at most $\epsilon$)

Proof:

  1. Consider some specific “bad” hypothesis $h$ whose error is at least $\epsilon$, then the probability that $h$ is consistent with the sampled data is at most $(1-\epsilon)^m$
  2. There is at most $|H|$ bad hypothesis.
  3. the probabilty that there exists a bad hypothesis that is consistent with all sampled data is at most $|H|(1-\epsilon)^m$ (union)
  4. the probabilty at the third step should also be at most $\delta$ by definition
  5. That is, $|H|(1-\epsilon)^m < \delta$
  6. Using the inequality 1 − x ≤$e^{-x}$, we get the equation in the theorem

Relationship between observed error rate and true error rate

In Non-realizable case (more general case), there may not be a “golden solution”, we can only compete with the best function (the function of smallest true error rate) in some concept class H. A natural hope is that picking a concept c with a small observed error rate gives us small true error rate. It is therefore useful to find a relationship between observed error rate for a sample and the true error rate.

Hoeffding Bound

Consider a hypothesis with true error rate p (for example, a coin of bias p) observed on $m$ examples (the coin is flipped m times). Let S be the number of observed errors (the number of heads seen) so S/m is the observed error rate.

Hoeffding bounds state that for any  $\epsilon$ ∈ [0, 1]

![Screen Shot 2022-04-01 at 11.22.38 PM](/figures/Screen Shot 2022-04-01 at 11.22.38 PM.png)

The relationship result by hoeffding bound

Let H be a finite hypothesis space. Let D be an arbitrary, fixed unknown probability distribution over X and let c ∗ be an arbitrary unknown target function. For any $\epsilon$, δ > 0, if we draw a sample S from D of size

image-20220402131238691

then probability at least (1 − δ), all hypotheses h in H have

image-20220402131254790

Proof: given a hypothesis h, by hoeffding boundinhg, we get that the probability that its observed error outside $\epsilon$ of its true error is at most

![Screen Shot 2022-04-02 at 3.54.11 PM](/figures/Screen Shot 2022-04-02 at 3.54.11 PM.png)

(based on hoeffding boudning, and the definition of $m$)

By union bound over all all h in H, we then get the desired result.

Infinite hophothesis set?

union bound is too loose! There may be many overlap between two hypothesises. That is, two hypothesises may label most data points the same.

Some definitions

  • The growth function of $H$ $g_H(m)$ is the maximum number of distinct labelling $H$ (a labelling for a $h \in H$ is just the results induced by $h$ for the given samples) can induce on any set $S$ of $m$ data points. (对于m个sample,最多能产生多少种label)

    • we say $H$ shatters(打碎) $S$ if $|H(S)| = 2^m$ , we assume this is a binary classification problem, i.e., the label is in {-1,1} (有这样一个m个sample,给任意一种label,都存在一个h可以产生这个label)

    • $g_H(m) = 2^m$ if exist S that H shatters it.

      ![Screen Shot 2022-04-02 at 11.54.20 PM](/figures/Screen Shot 2022-04-02 at 11.54.20 PM.png)

    • 2D linear seperator cannot shatter 4 points

    • D dimentional linear seperator can shatter D+1 points but cannot shatter D + 2 points

VC bound (relationship between data size and errors)
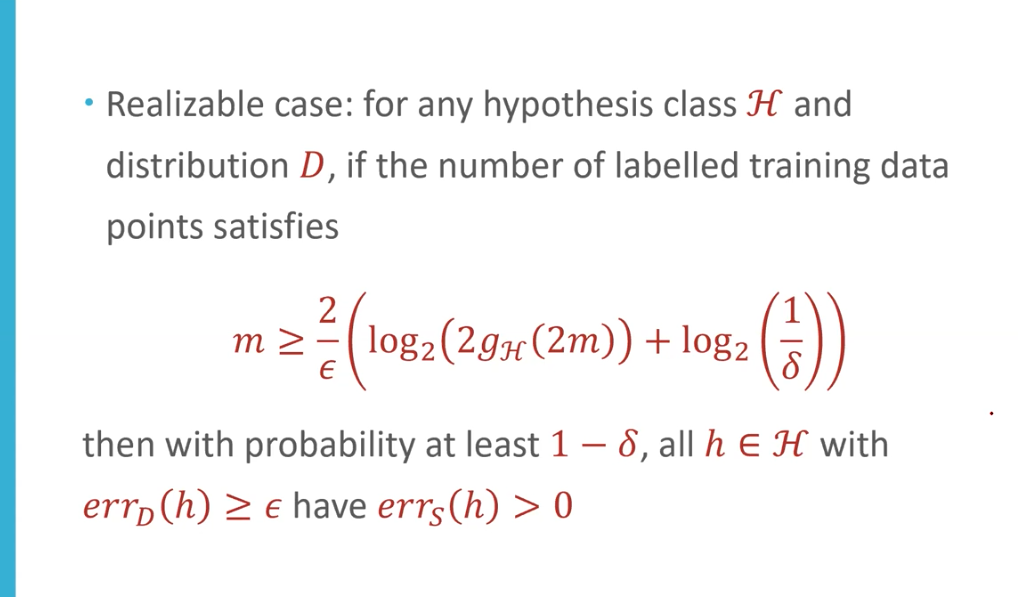
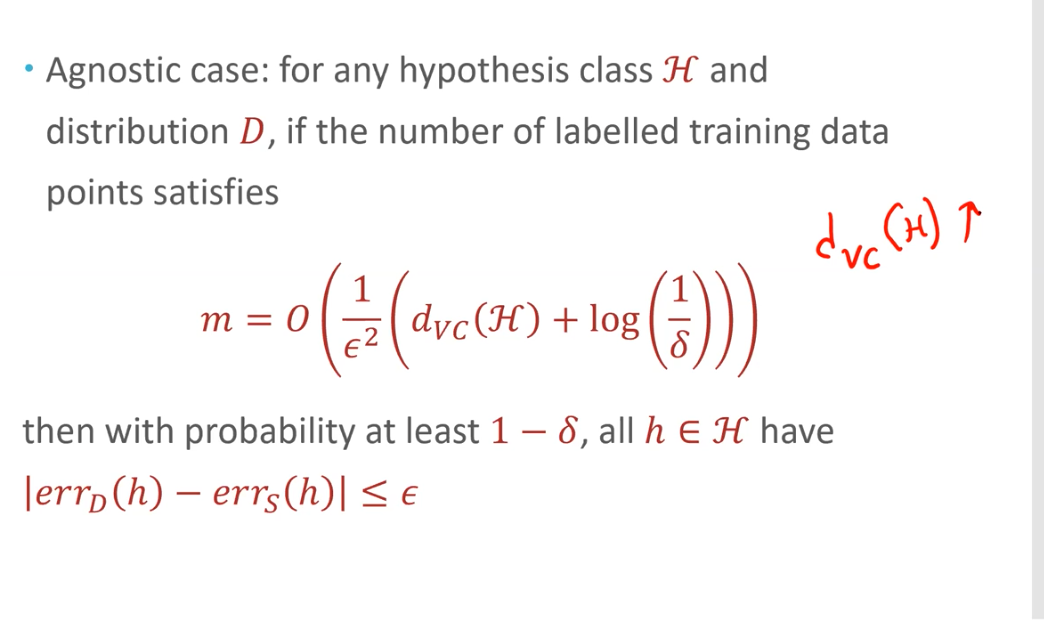
image-20220403000015185

If no golden target:

image-20220403011338282

VC dimension (the complexity of the hyphothesis set)

$d_{VC}(H) = $ the largest value of $m$ s.t. $g_H(m) = 2^m$, i.e., the greatest number of data points that can be shattered by $H$

For example, for a N-dimensional linear seperator, its VC dimension is $D+1$

Statistical Learning Style bounds, (fixed data size,relationships between the true error and the data error)
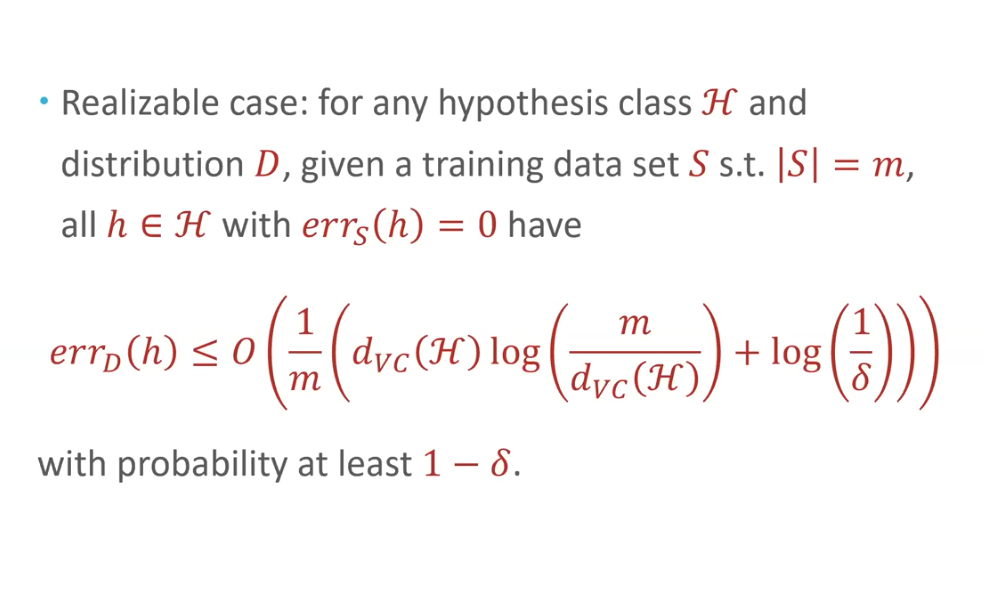
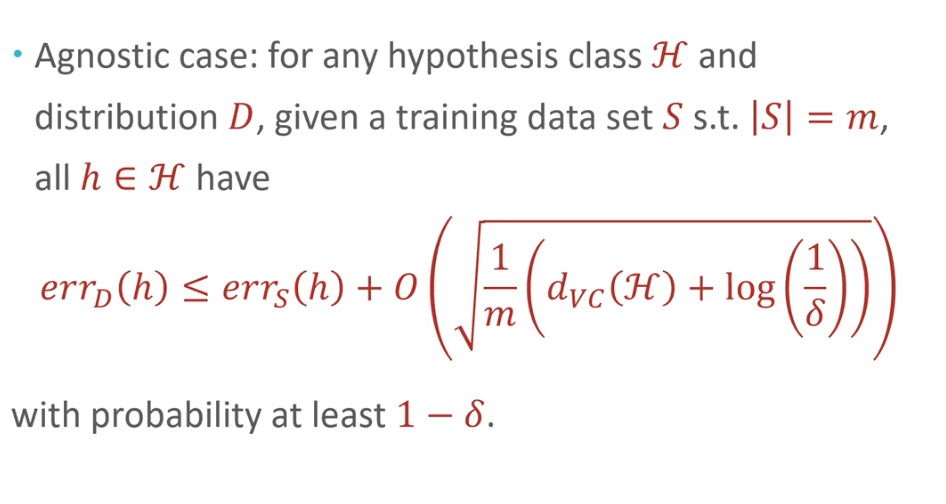
image-20220403011717814

image-20220403011757356

Agnostic case: trainning error is not zero

traning error decreases as VC dim increases (easier to )

the bound increases as VC dim increases (harder to generalize)
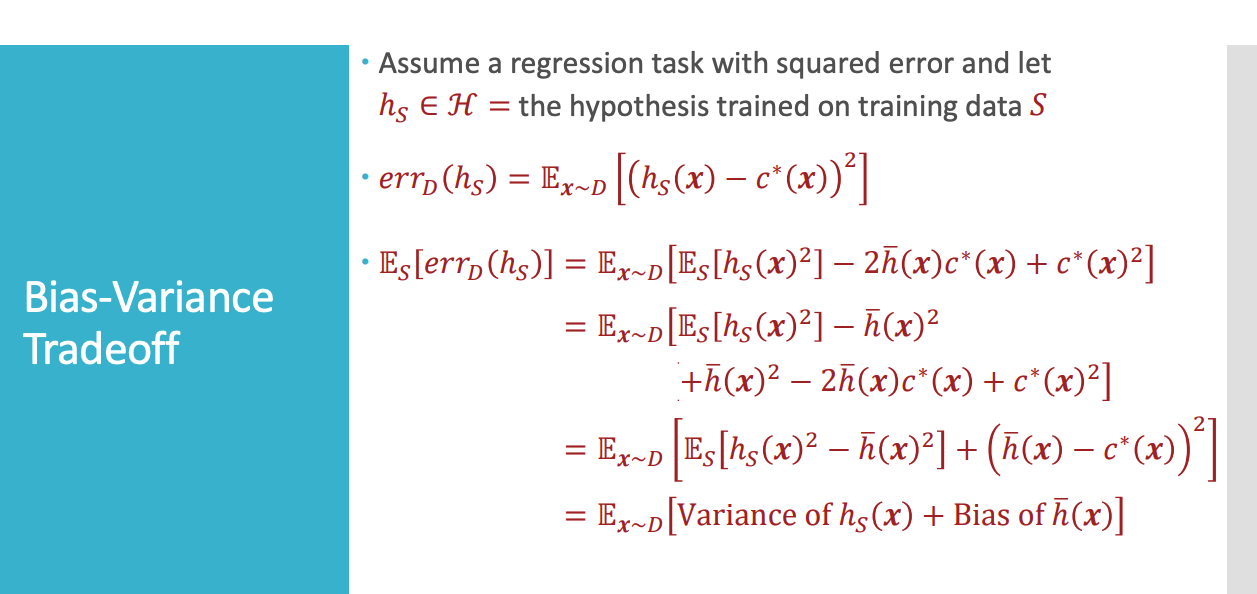
image-20220425114624651

Two analysis illustration (VC analysis and bias-variance)
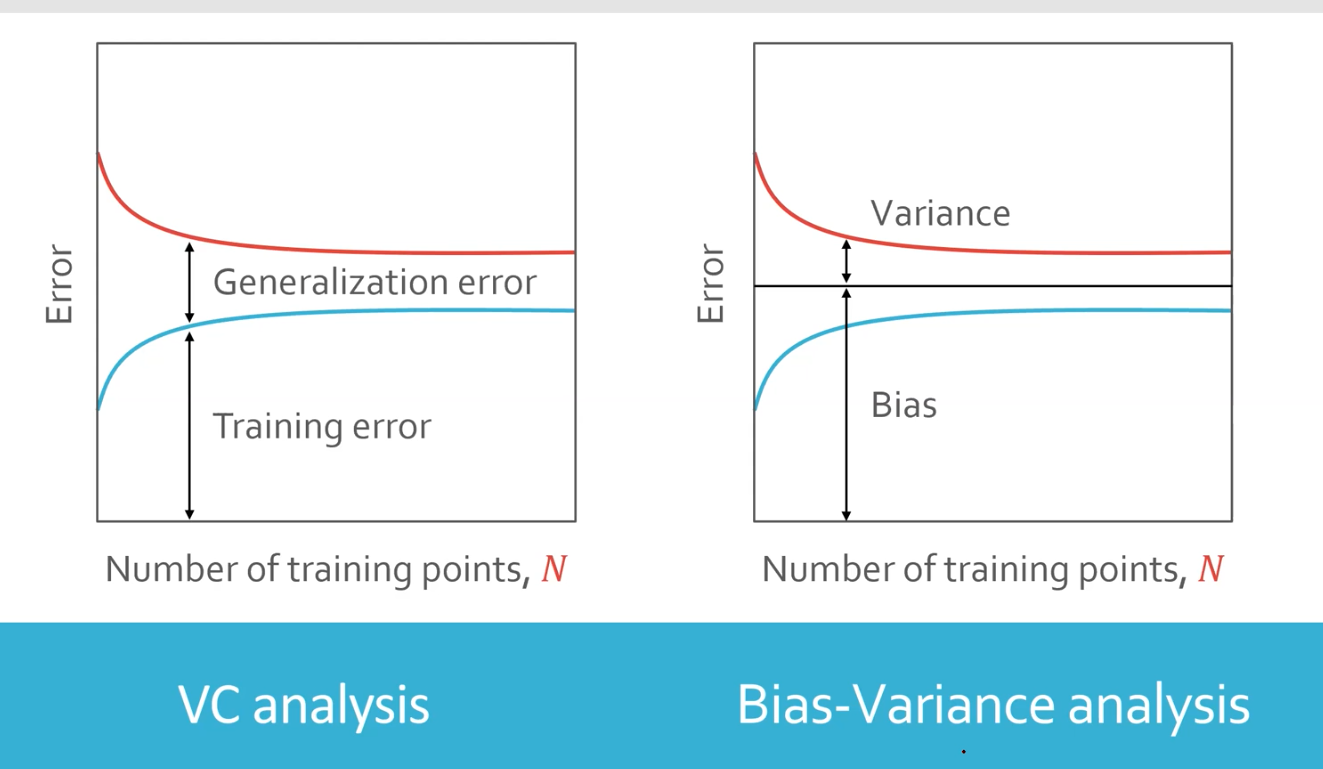
image-20220425162541501

GNNs for attacking

Now, all (at least from my knowledge) GNN-based works focus on attacking, that is, given a locked circuit, using GNNs to attack it (predict the correct key values).

These works can be roughly divided into two categories based on the target locking method.

To attack some logic locking methods, the problem can be formulated as a link prediction task. For example, for the MUX-based locking method, what the attacker is doing is actually trying to determine which edge in the MUX should be preserved.

Here are some papers (although most of them come from the same author)

  • ICCAD21 - UNTANGLE: Unlocking Routing and Logic Obfuscation Using Graph Neural Networks-based Link Prediction

  • DATE22 - MuxLink: Circumventing Learning-Resilient MUX-Locking Using Graph Neural Network-based Link Prediction

GNNs for node classification

  • DATE21- GNNUnlock: Graph Neural Networks-based Oracle-less Unlocking Scheme for Provably Secure Logic Locking
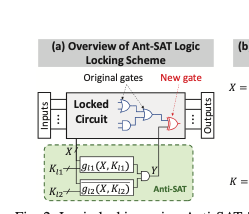
    • (Attack Anti-SAT) predict whether the node (gate) belongs to Anti-SAT (AN, green box) module or original design (DN, gray box)
    • image-20220508133120863
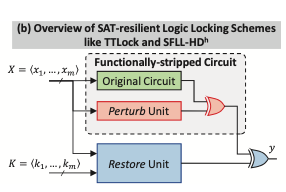
    • (TTLock and SFLL-HD) predict whether the node belongs to 1) orig design (DN) 2) pertub unit (PN) 3) restore unit (PN)
    • image-20220508171929174

A cheatsheet for some common operations I may need to ask Google again and again…

Pytorch

Select rows based on conditions of column values

Basic idea is to use conditions to find all true index, and select the row/column based on index

For example, return rows whose column 1 value is exactly 2:

1
a[:,a[:, 0] == 2]

Another example is (selct rows whose column values are all larger than 0)

1
a[(a > 0).all(1)]

2021年的总结

2021年又是在疫情中度过的一年。因为疫情,自己的大部分生活锁死在了宿舍。即便这样,2021也是我人生最“动荡”的一年。我就好像是一片充满补丁仍昂扬要追求大海的帆船,即便是狂风暴雨,但终究还是过完了这一年:虽然过去的旅程其实只是被风暴推着走的。

2021年是没有成果的一年:paper基本没有进展、学习上也没有学到什么新鲜有意思的东西、即便结婚却时常还是有孤独感。

不过也是很幸运的一年。其实不止是2021,感觉自己一直是比较幸运的人。爸妈给的脑子、大学碰到的同学、913的小伙伴、来美国后的labmate和特别友好的两位导师。我真的挺庆幸自己能活在他们的庇护下,一直都不需要为了生活和琐碎的人际关系发愁。

风格好像有点太阴沉了,积极点说吧!2021年我做到了这些:

  • 成为了名副其实的EDA/VLSI design/VLSI testing 半懂哥,基本上芯片是怎么从RTL到chip的也可以大概跟别人解释清楚啦
  • 再次成为幸运小子,两位导师对我都很好~(damn 好像不是我做到的哈哈哈 实在没什么写的了 还是写下来吧
  • 基本上完全适应美国的生活啦,甚至资本主义的羊毛都要被我薅秃了哈哈哈哈哈
  • 大概率拿到了apple的intern offer啦(其实本来没想申intern的。。就是老板让我去试试fellowship。。然后apple的人可能觉得我不够格但是research interest又挺适合他们intern需求的。。于是就。。。(upd,apple最后还真把fellowship给我了,邮件里对我方向的鼓励、presentation的认可也是很感动啊,一下子就有点报君黄金台上意的努力冲动了。)
  • 虽然paper没进展,但是两个proj都是有条不紊的继续着,好像暂时也没有排斥research 或者 不喜欢自己目前proj的想法,挺好的嘿嘿

然后是今年的计划(雄心勃勃

  • 两个proj第一学期都给我做完!然后第二学期再投一篇!You have to push yourself!不仅为自己,也要为两位这么nice的导师。OK?
  • 有时间就学着剪视频(哈哈哈每年愿望清单都有你)。It is always not a bad thing.
  • 好像没啥了额。。就祝你每天开心、不用压力太大,你已经很棒啦!

盗月社

看盗月社的时候,总会有种暖意。之前不知道为什么,后面明白了:是因为他们本身是温暖的、或者说,他们的视频、故事都是积极阳光的、他们就像太阳一样,会主动温暖身边的人。我想,这也是为什么他们的视频里人们也永远是那么热情友好吧。

是呀,我们也应该做一个这样温暖的人吧。人生其实也只有几十年,赚钱意义不是很大、改变造福世界又不太可能、做一个温暖的人,让自己和周围的人被阳光滋润着似乎是个挺靠谱的人生选择。主动表达自己的感激、永远乐观积极,给周围的人带去温暖而不是阴沉。希望我可以吧~

不过说起来,我其实不知道盗月社的大家是怎么能一直保持阳光的。也许他们背后也会脆弱也需要别人的温暖吧?反正我是这样的。虽然很早就明白人生注定是只属于自己的孤独的旅程,但是总是有很多时刻,我还是需要他人的情感支持。

遗憾

也许人生就是这样,当你选择做一个随风飘流的小船儿时,你注定就会有遗憾。

回顾我的二十四年,遗憾其实还不少。譬如小时候喜欢围棋却没有学习资源没有老师,只能自己靠着对“围”的理解瞎捣鼓;譬如小学自己模仿qq三国画了几十张地图,还设计了完善的装备 剧情 战斗系统 (虽然所有玩法都是基于掷骰子的随机性哈哈哈),但是大学却没有想过(或者说没有勇气?)去找游戏方面的工作,曾经的那些地图也都没有保存下来;再比如小时候挺喜欢画画,曾经对着书上的风景画照着画,被美术老师以“你这肯定是贴着画直接抄的”为理由给了不及格,委屈的哭的要死,也顺带扼杀了我的美术乐趣;在比如大学唯一报名的辩论队,最后还是怂了没去面试。。。

大部分的遗憾其实还是源自自己的短视和懦弱、短视可能受家庭环境教育影响、但是懦弱纯粹就是自己的问题了。这也许也是为什么我看着白鹿原里的白孝文如此“触目惊心”、看明朝那些事那么振聋发聩了。所以我很喜欢那句自己说了七年的那句话:follow your heart。

那么就以这段话作为结尾、也作为对新年的希冀吧!不论要做什么决定,不用担心后果、不用考虑其他有的没得影响,只要记得:

唯愿此心无怨尤

Preliminaries

Geometric deep learning means the deep learning especially for geometric objects, such as graphs and point clouds. Recently, their applications in VLSI become more and more common and important for several reasons (from my naive perspectives):

  1. most study objects in VLSI are natually geometcal. e.g. netlist -> graph, layout pins -> point cloud, …
  2. there exist many heuristical algorithms in VLSI domain, whcih provides a vision for DL techniques to improve them
  3. We have enough data in the industry, now-adays, the data scale is in a billion level.

This artical is a summray of all related papers I read.

GNN-RE: Graph Neural Networks for Reverse Engineering of Gate-Level Netlists

Task

  1. identify the boundaries between the modules or sub-circuits implemented in netlists (still node-classification)
  2. classify the sub-circuits based on their functionalities. (still node-classification, not a graph-classification, but use the node labeling results to vote for the graph labeling)

The two steps are in the flow of reverse engineering

reverse engineering is to obatin the circuit information (netlist, sub-circuit functions …) from the sold IC chip.

Methods

  1. Netlist -> undirected graph.

  2. Feature vectors (for each node):

    1. connectivity to PIs/POs
    2. Fan-in/fan-out degree
    3. gate’s + neighboring (2-hops) functionality (# of AND = 3, # of ORs = 2 (depth) … and so on)
    4. binary value: is sequential or combinational
    5. binary value: whether a gate is controlled by a KeyInput or not

    I doubt these feature vectors may represent the original netlist with some potential bias information. That is, two different netlists may generate the same graph with same feature vectors. (Especially their type c features)

  3. graph sampling (a large netlist graph to many sub-graphs): GraphSAINT, random walk sampler (RWS).

    1. Basic idea, select $r$ roots (randomly), and start from these roots, randomly walk $w$ steps and sample these nodes.
  4. Models: after experiments, RWS sampling + GAT is used

Result

  • Hidden dim : 256 > 128,512
  • depth: 2 > 1,4
  • # of GNN layers? (it seems that they use depth as the neighborhood depth per layer…)
  • GAT > GraphSAGE, GAAN… (they use GraphSAGE to determine the beset arguments, like depth, dim, but finally select a different model without changing these arguments??)

Boundary identification

given a certain design type, (like adder-mul,mix, results of two adders are fed into a multiplexer), generate a series of such designs, (by using different kinds of adders/multiplexers), see the node classification performance.

So the experiment for industrial design and even not for a general design.

Graph Learning-Based Arithmetic Block Identification

Done by my friend :)

Task

Arithmetic Block Identification: input-flatenned netlist graph; output-arithmatic block (the same with last paper)

flattened gate-level netlist, where only primitive gates are instanced, while the design hierarchy is unknown.

Method

ABGNN

  1. Bidirectional: consider both message flow from predecessors(fanin) and successfulsors(fanout).
  2. Asynchronous: At each step $d$ (or so-called depth of GNN), starting from those nodes whose distance is $k-d$ with the nodes (k is the total depth) and propagate through the signal direction.
  3. input features: gate type
  4. Output: predicts the input wires and the output wires of arithmetic blocks.

Input-output matching

we obtain an input set and an output set (by ABGNN), and we need to find the matching, i.e., a mapping from input set to output set. (formulate as a maximum flow problem)

Other techniques

  • Two seperate models to predict input and output. (A node can be both input and output for different arithmatic blocks)
  • Data imbalance (two many non-input and non-output)
    • oversampling (data-level)
    • Cost sensitive learning: new cost -> $C’{ij} = p(j|x)C{ij}$, the cost the cost for predicting x as class j when the actual class is i
    • penalty weight for two losses

It is intresting to see that the task is divided into two steps, where the first one is translated as a DL task while the second one is solved by some traditional beautiful algorithm.

Results

Just list some interesting parts:

  • GraphSAGE is better than others, which aligns with my belief
  • asynchronous is slightly better than a normal model, interesting to see why?

A graph placement methodology for fast chip design

A very famous but also controversial paper by Google

Task: floorplanning

placing netlists onto chip canvases (two-dimensional grids) so that performance metrics (for example, power consumption, timing, area and wirelength) are optimized, while adhering to hard constraints on density and routing congestion.

Basic Idea

Use GNN to obtain graph embedding, which is used to 1) generate next step instruction (as the encoder of the RL network) 2) predict the reward.

For the RL module, each action corresponds to selecting a macro and place it in the grid. Here, the macro order is determined heuristically.

Edge-GNN

  • node feature: node type, width, height, x and y coordinates, and its connectivity to other nodes
  • $e_{ij} = fc_e(v_i|v_j)$
  • $v_i = mean_{j\in N(v_i)}(e_{ij})$
  • according to the results, much better than GCN (how about bidirectional GCN?)

Assign values to pytorch tensor

Everytime when I try to initialize a pytorch tensor, I would like to use torch.zeros:

1
sum_each_bbox = torch.zeros(len(bbox),len(bbox[0]))

But when I try to assign interger value to the tensor, like:

1
2
3
sum_each_bbox[i,j] = sum(bbox[i][j])
print(sum_each_bbox[i,j] )
print(bbox[i][j])

The value will be different:

1
2
tensor(16906704.)
16906703

Instead, we should specify the data type to make it assigned correctly.

1
sum_each_bbox = torch.zeros(len(bbox),len(bbox[0]),dtype=torch.int64)

In python, we sometimes need to define an empty 2-D list to store something, i.e., tensors for different sizes at different grid point in the 2-D list.

Using Google, you may initialize the list in this way:

1
a = [0*dim_0]*dim_1

In this way, the reference of the second dim is the same, when you change a[0][1], a[0][0] will also be changed. (if a stores tensors)

The correct way is:

1
2
3
4
for i in range(dim_0):
a.append([])
for j in range(dim_1):
a[i].append([])